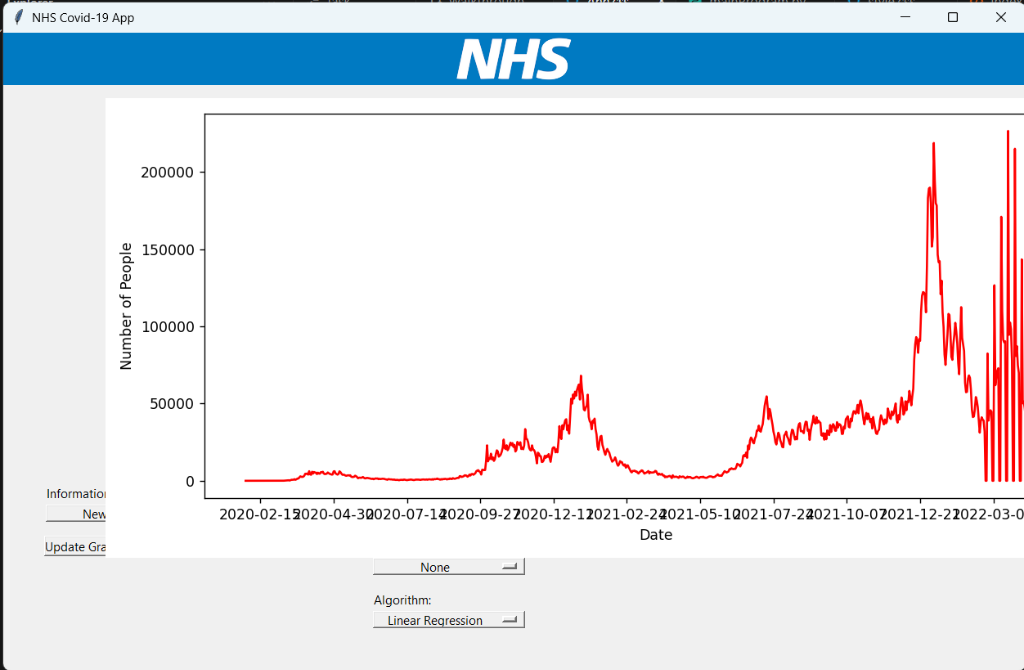
Interactive Data Dashboard
The core interface provides a real-time visualization of pandemic metrics. Users can toggle between new cases, daily deaths, and cumulative totals with high-fidelity matplotlib integration.
- Dynamic coordinate plotting
- Clean, professional aesthetic
- Zero-latency data updates
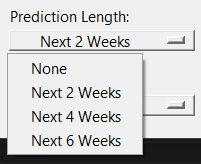
Triple-Algorithm Prediction
Harness the power of machine learning to anticipate future trends. The tool integrates scikit-learn to provide three distinct forecasting models.
Linear
Trend-line estimation
Logistic
Growth curve modeling
SVM
Vector machine regression
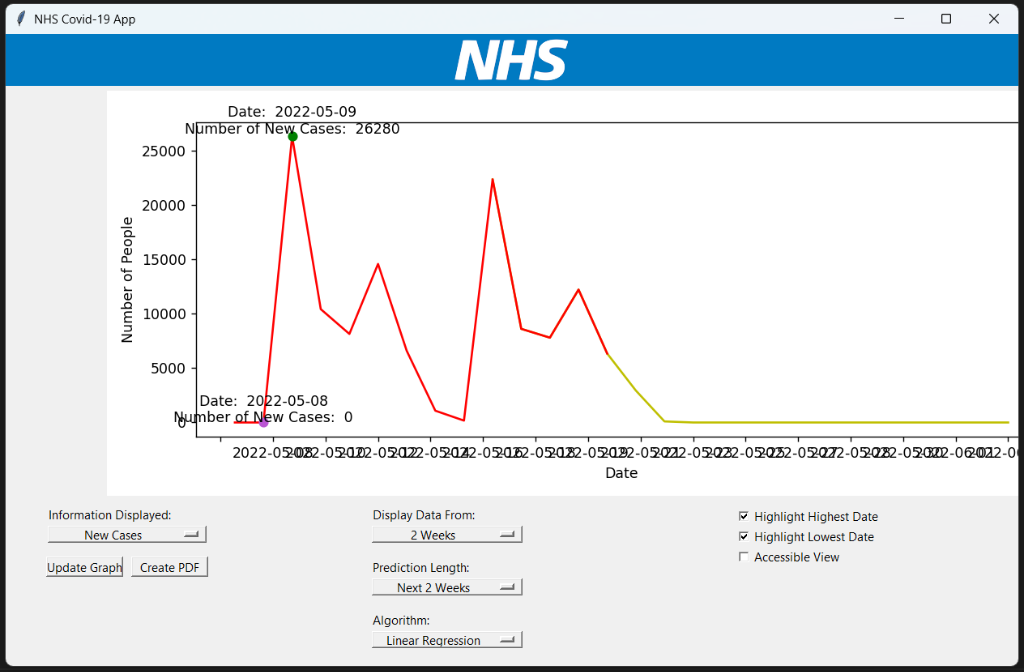
Intelligent Peak Detection
Automatically isolate and analyze significant data points. The analysis engine identifies the highest peaks and lowest troughs within any selected timeframe.
- Automated peak (green) marking
- Low-point (purple) identification
- Contextual data labeling
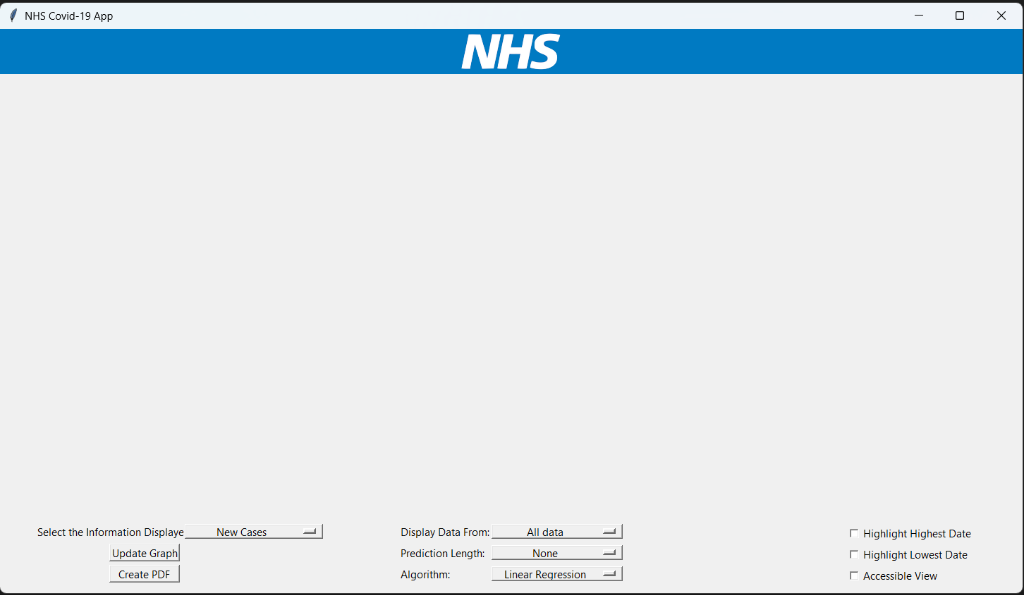
Granular Control & Accessibility
Built for professionals, designed for everyone. Customize your analysis with precision controls.
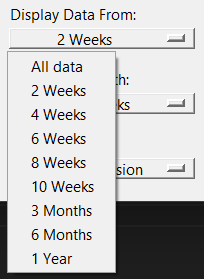
Flexible Timeframes
Analyze from "All Data" down to specific 2-week snapshots.
System Utilities
Generate professional reports or switch to high-contrast accessible modes instantly.